Globally trusted defense against cybercrime
Combining detection, threat intelligence and robust disruption & takedown, Netcraft’s automated digital risk protection platform keeps your organization and customers safe from phishing, scams, fraud and cyber attacks.

Defeating cyber attacks with unmatched scale and effectiveness
Netcraft’s online brand protection operates 24/7 to discover phishing, fraud, scams, and cyber attacks through extensive automation, AI, machine learning, and human insight. Our disruption & takedown service ensures that malicious content is blocked and removed quickly and efficiently—typically within hours.

A focus on innovation to keep up with ever-evolving cybercrime trends
Netcraft’s cybercrime detection & disruption platform
From brand protection, uncovering a wide variety of potential cyber attacks and surfacing carefully validated threat intelligence to rapid response with industry-leading takedown speeds, Netcraft’s digital risk protection platform maximizes protection for your brand, organization, employees, and customers.

Resources & Insights
Blog
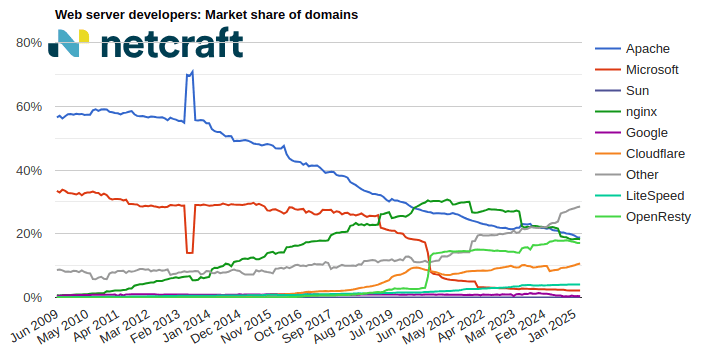
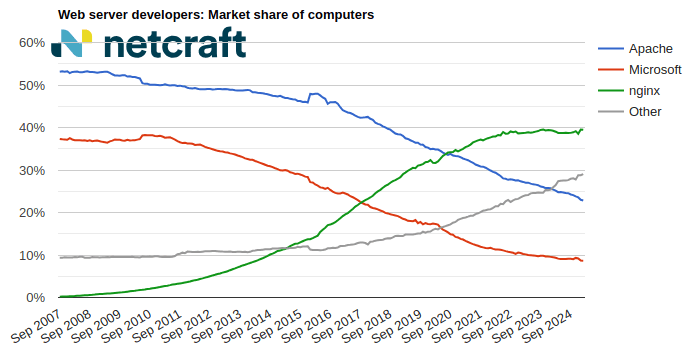
March 2025 Web Server Survey
In the March 2025 survey we received responses from 1,197,680,522 sites across 275,633,322 domains and 13,402,722 web-facing computers. This reflects … Read More
Learn More
Blog
February 2025 Web Server Survey
In the February 2025 survey we received responses from 1,180,650,484 sites across 274,656,941 domains and 13,480,350 web-facing computers. This reflects … Read More
Learn More
Blog
The Bleeding Edge of Phishing: darcula-suite 3.0 Enables DIY Phishing of Any Brand
Key Data Overview The criminals at darcula are back for more blood, and they mean business with one of the … Read More
Learn More
What’s that site running?
Discover the web technologies and internet infrastructure powering any site.
Discover more insights & tools
Report malicious sites to Netcraft, read the Netcraft blog, and explore more resources.
Customers we protect
As a well-respected industry leader, many of the largest brands and organizations around the world trust Netcraft. Our customer base includes a diverse mix of industries, sizes, and organizational types, including:

Schedule time with us
Learn more about Netcraft’s powerful brand protection, external threat intelligence and digital risk protection platform